
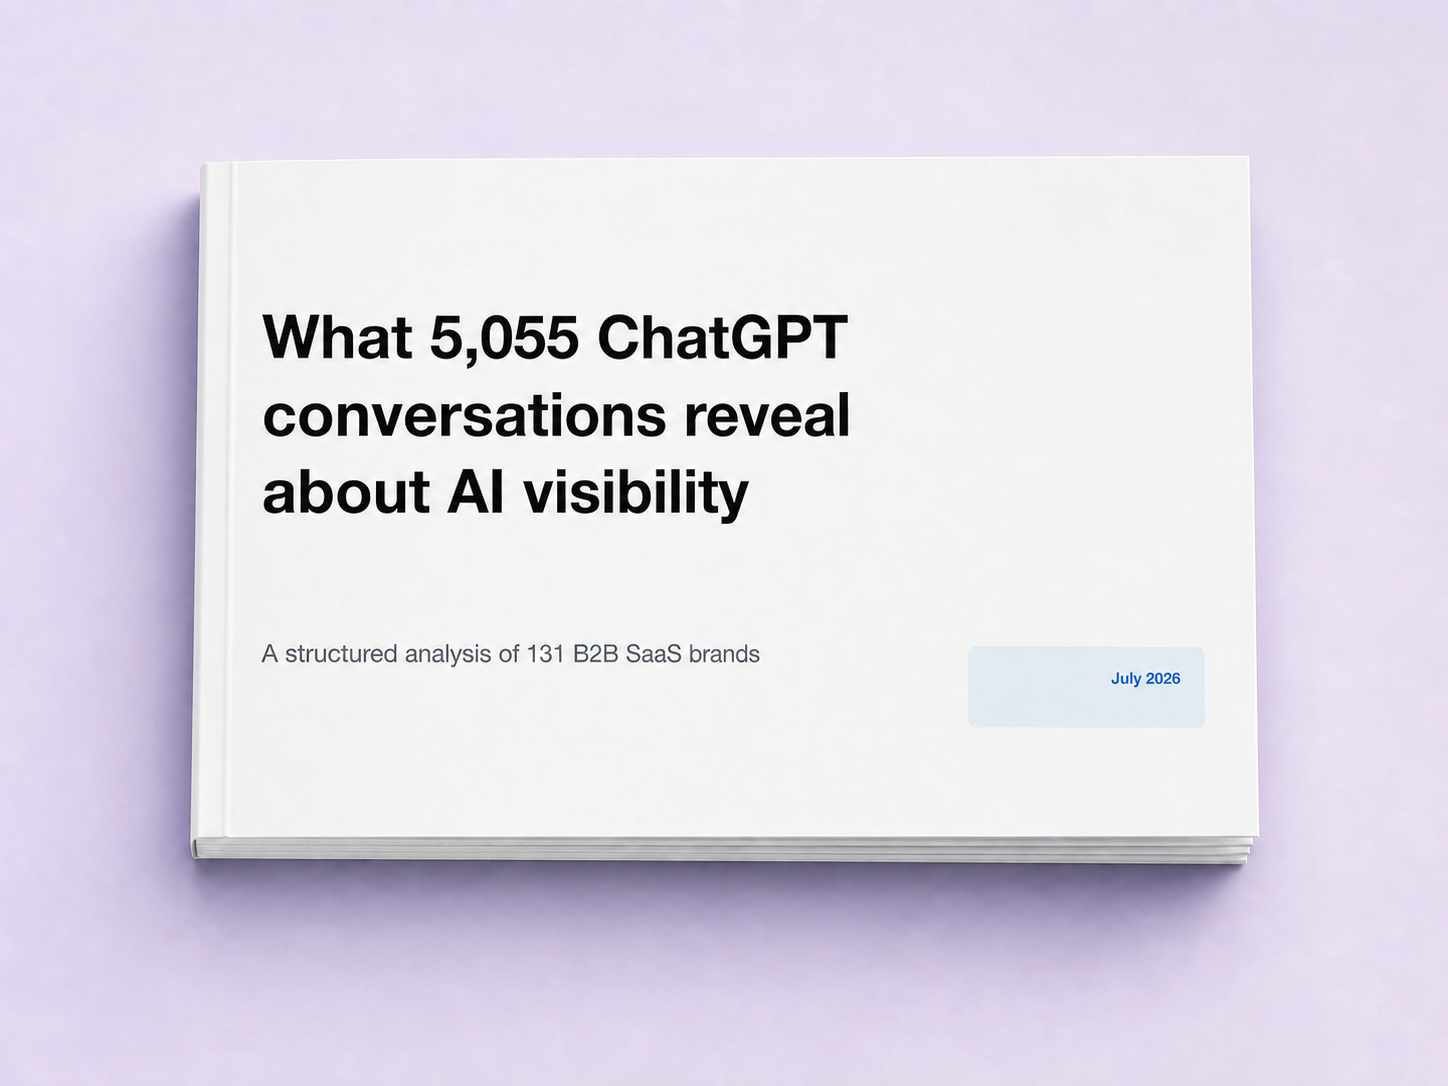
What 5,055 ChatGPT* conversations reveal about AI visibility
We tested 131 B2B SaaS brands across buyer-style questions to understand when brands appear, whose sources shape the answer, what changes in follow-up conversations, and whether visibility leads to favorable framing.
131
B2B SaaS brands
5,055
buyer-style conversations
18,036
answer citations analyzed
Published July 30, 2026
* This study used ChatGPT only. Viziquo audits cover ChatGPT, Claude, Gemini, Google AI Mode, Google AI Overview, Microsoft Bing AI Answers (Copilot Search), and Perplexity.
EXECUTIVE SUMMARY
AI visibility is not one score
Four different things get lumped into "visibility," and they don't move together.
Being recognized is easy. Being discovered is hard.
When buyers name the brand directly, it shows up almost every time (99.9%). When they don't, it shows up in only about 1 in 8 conversations. Knowing the brand and finding the brand are two different problems — and today, only one of them is solved.
Showing up doesn't mean the model is using the brand's own story to explain it.
Even in the organic conversations where the brand appeared, most of what the model said about it came from competitors' content (44%) or other third-party sources (39%). Only 1 in 6 supporting citations came from the brand's own site.
Who gets mentioned is decided early. What's said about them keeps changing.
Once a model decides who to mention, that decision rarely changes as the conversation continues. But the conversation itself keeps evolving: nearly half of follow-ups added new evidence or sources beyond the first answer. A brand missing at turn one usually stays missing — which is exactly why the first answer deserves the most scrutiny, even as later turns keep shaping how the story gets told.
The Takeaway: whether a brand appears, whether it's found without help, whether the model draws on its own content, and whether it's described favorably are four separate scorecards. Reporting one number hides which of these actually needs fixing.
SIX FINDINGS
What changed when the question, intent, source context, or turn changed
The following findings use aggregate conversation-level results. Each chart shows the evidence; the adjacent interpretation explains what the pattern means and what it does not prove.
FINDING 01 · DISCOVERY
Being known is not the same as being discovered
Explicitly naming a brand almost guaranteed that it appeared in the answer. Asking about a buyer problem without naming the brand produced a very different result.
Brand appearance changes sharply with question context
Share of conversations in which the tested brand appeared
Brand-prompted
99.9%
1,064 / 1,065 conversations
Competitor-led
32.1%
319 / 995 conversations
Organic
12.2%
364 / 2,995 conversations
| Category | Rate | Appeared / tested |
|---|---|---|
| Brand-prompted | 99.9% | 1,064 / 1,065 |
| Competitor-led | 32.1% | 319 / 995 |
| Organic | 12.2% | 364 / 2,995 |
When buyers already know to ask about a brand by name, it shows up almost every time — 1,064 of 1,065 conversations. That confirms the brand is recognized. It says nothing about whether the model would ever introduce that brand to someone who didn't already know to ask.
That's exactly what happens when the question doesn't name the brand. Organic discovery — a buyer describing their problem without naming any vendor — surfaced the brand in only 12% of conversations. Even when a competitor was named instead, the tested brand still only showed up about one time in three.
This isn't a handful of weak brands dragging the average down. 29 of the 131 brands tested never appeared organically at all, and roughly 6 in 10 showed up in no more than 1 in 10 of their organic conversations. Being unfindable without a name is the norm, not the exception.
KEY TAKEAWAY
A single visibility score can hide this completely. A brand can look strong on paper — driven by buyers who already knew to search for it — while staying invisible to the buyers discovering the category for the first time. Those are the buyers a brand can least afford to lose, because they haven't decided who to trust yet.
Rates are based on all tested conversations. "Organic" means the buyer's question named neither the tested brand nor a tracked competitor.
FINDING 02 · CATEGORY ASSOCIATION
Category mentions increase the odds of being found
A buyer doesn't need to know a brand's name to find it — but the model does need enough category context to connect the buyer's problem to the right part of the market.
Category language creates a discovery bridge
Organic brand appearance rate
2.7x higher with category language
| Category | Rate | Appeared / tested |
|---|---|---|
| Fully unbranded | 5.4% | 45 / 833 |
| Category-led | 14.8% | 319 / 2,162 |
Without that context, discovery is nearly nonexistent: fully unbranded questions surfaced the tested brand in only about 1 in 20 conversations. Add category language — the same problem, described the way the market actually talks about it — and that rate nearly tripled, to about 1 in 7.
Still, "nearly tripled" shouldn't be mistaken for solved. Even with category context doing its job, the brand was still missing more than 8 times out of 10. Category language opens the door; it doesn't guarantee anyone walks through it. And this wasn't a pattern created by a few large categories skewing the average — it held up in the balanced test set and across 11 of the 12 business functions tested.
KEY TAKEAWAY
Category language is the bridge between a buyer's problem and a brand's relevance. Without it, the model has no path from "I have this problem" to "this is who solves it."
WHAT TO DO
- Build explicit associations between the brand, the category, the buyer's problem, and the use case — not as short SEO keywords, but as clear statements of role
- Make the product's part in a buyer's situation unambiguous across category pages, use-case pages, and comparisons
- Extend the same language into documentation and third-party coverage, not just owned marketing pages
Category-led and fully unbranded questions are both organic — neither names the tested brand or a tracked competitor.
FINDING 03 · BUYER INTENT
Visibility rises when the buyer is closer to choosing a vendor
The closer a buyer is to actually choosing a vendor, the more likely the brand is to show up.
Organic visibility rises closer to a buying decision
Organic brand appearance rate by buyer intent
Transactional / Vendor Selection
30.2%
91 / 301 conversations
Comparison
14.6%
115 / 789 conversations
Tactical / How-To
11.7%
76 / 649 conversations
Problem-Aware
10.0%
36 / 361 conversations
Educational
5.2%
12 / 230 conversations
Diagnostic
5.1%
34 / 665 conversations
| Category | Rate | Appeared / tested |
|---|---|---|
| Transactional / Vendor Selection | 30.2% | 91 / 301 |
| Comparison | 14.6% | 115 / 789 |
| Tactical / How-To | 11.7% | 76 / 649 |
| Problem-Aware | 10.0% | 36 / 361 |
| Educational | 5.2% | 12 / 230 |
| Diagnostic | 5.1% | 34 / 665 |
Questions framed around picking a vendor surfaced the brand in about 3 in 10 conversations — the strongest environment tested. Comparison questions were the next best, but at roughly half that rate, about 1 in 7.
Educational and diagnostic questions — the ones buyers ask before they even know they need a vendor — were the weakest environments by far, each surfacing the brand in only about 1 in 20 conversations. The same pattern shows up at a broader level: questions where the buyer explicitly asked for a recommendation surfaced the brand roughly 4 times as often as purely informational questions.
This doesn't mean educational content is a waste — it means it's answering a different question than the shortlist moment is. A brand can win every educational conversation and still be absent when it matters most: when the buyer is finally choosing.
KEY TAKEAWAY
The data shows the brand appears far more often once a buyer is ready to choose (about 3 in 10) than while they're still learning about the space (about 1 in 20). That gap is easy to misread as "vendor-selection content matters most." The more useful read is the opposite: by the time a buyer is comparing vendors, the shortlist is often already forming — so a brand that's invisible during the earlier, exploratory stage may never get the chance to be considered later, no matter how strong its vendor-selection presence looks in aggregate.
WHAT TO DO
- Treat the low educational-stage visibility as the priority, not the vendor-selection number — this is where a brand either gets onto a buyer's radar or doesn't
- Build content that shows up while a buyer is still framing the problem, not just once they're ready to compare vendors
- Keep strengthening vendor-selection and comparison content too, but don't mistake strong late-stage visibility for a healthy funnel if early-stage visibility is weak
Each buyer persona in this study represents a distinct objective rather than a stage in a single funnel — the data does not follow one buyer from research through decision, so the connection between early and late-stage visibility is a strategic inference, not a directly measured result.
FINDING 04 · SOURCE AUTHORITY
Appearing in an answer does not mean owning the narrative
Even when the brand appeared organically, the story around it usually wasn't the brand's own to tell.
Appearance does not mean ownership of the narrative
Answer citations in organic conversations where the tested brand appeared
1,757 answer citations
Competitor-owned
43.9% · 771
Third-party
38.6% · 679
Brand-owned
17.5% · 307
Most missed visibility was not a competitor win
Among 2,631 organic conversations where the tested brand was absent
A tracked competitor appeared
38.2%
1,005 conversations
No tracked competitor appeared
61.8%
1,626 conversations
| Source ownership | Share | Citations |
|---|---|---|
| Competitor-owned | 43.9% | 771 |
| Third-party | 38.6% | 679 |
| Brand-owned | 17.5% | 307 |
In those answers, about 44% of the supporting citations pointed to competitor-owned content, and another 39% went to other third-party sources. Only about 1 in 6 citations led back to the brand's own site.
That means visibility can be borrowed. The model can mention a brand by name while pulling its actual explanation — the category framing, the integration detail, the tradeoff — from a competitor's page instead of the brand's own.
The reverse is just as important: when the brand didn't appear, that usually wasn't a competitor winning the conversation. In roughly 6 out of 10 of those missed conversations, no tracked competitor showed up either. The brand wasn't beaten — the conversation just didn't surface anyone.
KEY TAKEAWAY
Being mentioned and being the source of truth are two different wins. A brand can appear in an answer and still have a competitor doing the explaining. And when a brand goes missing, that's just as often an open category gap as it is a loss to a named competitor — so "we got beat" is often the wrong read.
WHAT TO DO
- Strengthen first-party content that answers what the model actually needs when it explains the brand — specs, integrations, comparisons, implementation detail, proof
- Build independent third-party validation (reviews, analyst coverage, community discussion) rather than relying on owned content alone
- Before assuming a missed conversation was a competitor win, check whether it's really a category or association gap instead (see Finding 02)
Citation shares reflect organic conversations where the tested brand appeared, not all conversations. Across the full dataset, the split shifts to 36% competitor-owned, 39% third-party, and 25% brand-owned.
FINDING 05 · MULTI-TURN CONVERSATIONS
Who gets mentioned is decided early. What's said about them keeps changing.
Once a model decides who to mention, that decision rarely changes as the conversation continues.
Later turns added evidence far more often than new brands
Share of 718 organic multi-turn conversations
77.3%
1-turn · 3,905
20.1%
2-turn · 1,017
2.6%
3-turn · 133
Any new citation appeared after turn 1
49.4%
355 conversations
A competitor first appeared after turn 1
1.8%
13 conversations
The tested brand first appeared after turn 1
0.8%
6 conversations
| Later-turn outcome | Share | Conversations |
|---|---|---|
| Any new citation appeared after turn 1 | 49.4% | 355 |
| A competitor first appeared after turn 1 | 1.8% | 13 |
| The tested brand first appeared after turn 1 | 0.8% | 6 |
Only 6 of 718 organic multi-turn conversations introduced the tested brand for the first time after the first answer — under 1%. A brand missing at turn one almost always stays missing.
But the conversation itself keeps evolving. Nearly half of those same conversations added new evidence or sources beyond the first answer — deepening the comparisons, implementation detail, objections, and recommendations the model offered.
That split matters for what multi-turn testing is actually good for. It isn't a mechanism for rescuing weak first-answer discovery — that decision is made early and rarely reopens. It's how you see the story keep developing after that: what evidence surfaces, what tradeoffs get raised, and how the framing shifts as a buyer keeps asking.
KEY TAKEAWAY
Multi-turn testing shows how the model builds its case over a real conversation — it doesn't fix a brand's absence from the first answer. If a brand isn't appearing at turn one, more turns won't solve that; the fix belongs earlier in the funnel, not later in the conversation.
WHAT TO DO
- Use multi-turn results to see how evidence, tradeoffs, and recommendations evolve — not as a discovery fix
- If a brand is weak at turn one, treat that as the priority; don't expect later turns to compensate
- Watch how framing shifts across turns — this is where positioning risk or opportunity actually shows up, even when the same brands keep appearing
Follow-ups were adaptive, not randomly assigned — each one responded to what the model actually said in the prior turn. Competitor first-appearance detection used exact, case-sensitive matching and may miss aliases.
FINDING 06 · BRAND FRAMING
Higher visibility did not guarantee favorable framing
Showing up more often didn't make the story better.
Higher visibility did not guarantee favorable framing
Per-brand organic appearance rate grouped by overall tone
| Tone | Recommendation | Brands | Avg. organic rate |
|---|---|---|---|
| Mixed | Conditional | 84 | 12.3% |
| Positive | Conditional | 24 | 6.7% |
| Positive | Moderate | 13 | 19.9% |
| Positive | Strong | 7 | 13.2% |
Showing the four largest tone × recommendation groups (128 of 131 brands). 3 brands in smaller mixed + moderate/strong groups are omitted. Correlation between organic visibility and positive tone: r = -0.027.
| Brand id | Tone | Organic rate | Recommendation |
|---|---|---|---|
| brand_001 | mixed | 16.0% | conditional |
| brand_002 | mixed | 19.2% | moderate |
| brand_003 | positive | 13.0% | conditional |
| brand_004 | mixed | 44.4% | conditional |
| brand_005 | mixed | 0.0% | conditional |
| brand_006 | positive | 8.7% | conditional |
| brand_007 | mixed | 7.7% | conditional |
| brand_008 | positive | 3.8% | conditional |
| brand_009 | mixed | 24.0% | conditional |
| brand_010 | mixed | 0.0% | conditional |
| brand_011 | mixed | 30.4% | conditional |
| brand_012 | mixed | 0.0% | conditional |
| brand_013 | mixed | 3.7% | conditional |
| brand_014 | positive | 8.7% | conditional |
| brand_015 | mixed | 63.6% | conditional |
| brand_016 | mixed | 30.4% | conditional |
| brand_017 | mixed | 11.1% | conditional |
| brand_018 | positive | 13.0% | conditional |
| brand_019 | positive | 4.3% | conditional |
| brand_020 | mixed | 8.7% | conditional |
| brand_021 | mixed | 20.8% | conditional |
| brand_022 | mixed | 16.0% | conditional |
| brand_023 | positive | 30.4% | moderate |
| brand_024 | positive | 4.2% | conditional |
| brand_025 | mixed | 33.3% | conditional |
| brand_026 | mixed | 4.3% | conditional |
| brand_027 | mixed | 26.1% | conditional |
| brand_028 | mixed | 25.0% | conditional |
| brand_029 | mixed | 20.8% | conditional |
| brand_030 | positive | 34.8% | moderate |
| brand_031 | positive | 0.0% | conditional |
| brand_032 | mixed | 16.0% | conditional |
| brand_033 | positive | 7.4% | moderate |
| brand_034 | positive | 0.0% | strong |
| brand_035 | positive | 0.0% | conditional |
| brand_036 | mixed | 8.3% | conditional |
| brand_037 | mixed | 4.3% | conditional |
| brand_038 | mixed | 42.3% | conditional |
| brand_039 | positive | 9.5% | conditional |
| brand_040 | mixed | 4.8% | conditional |
| brand_041 | positive | 9.5% | conditional |
| brand_042 | mixed | 7.7% | conditional |
| brand_043 | positive | 28.6% | moderate |
| brand_044 | mixed | 10.0% | conditional |
| brand_045 | mixed | 14.3% | conditional |
| brand_046 | mixed | 19.2% | conditional |
| brand_047 | positive | 0.0% | moderate |
| brand_048 | positive | 0.0% | strong |
| brand_049 | mixed | 4.3% | conditional |
| brand_050 | mixed | 0.0% | conditional |
| brand_051 | mixed | 21.7% | moderate |
| brand_052 | mixed | 0.0% | conditional |
| brand_053 | positive | 4.0% | conditional |
| brand_054 | positive | 14.3% | moderate |
| brand_055 | mixed | 7.7% | conditional |
| brand_056 | mixed | 0.0% | conditional |
| brand_057 | positive | 12.5% | moderate |
| brand_058 | positive | 0.0% | conditional |
| brand_059 | mixed | 15.8% | conditional |
| brand_060 | positive | 36.0% | strong |
| brand_061 | positive | 16.7% | conditional |
| brand_062 | mixed | 15.8% | conditional |
| brand_063 | mixed | 4.8% | conditional |
| brand_064 | mixed | 9.1% | conditional |
| brand_065 | mixed | 10.0% | conditional |
| brand_066 | mixed | 0.0% | conditional |
| brand_067 | mixed | 0.0% | conditional |
| brand_068 | mixed | 4.3% | conditional |
| brand_069 | mixed | 26.9% | conditional |
| brand_070 | mixed | 4.8% | conditional |
| brand_071 | positive | 16.7% | conditional |
| brand_072 | mixed | 39.1% | conditional |
| brand_073 | positive | 4.2% | conditional |
| brand_074 | mixed | 4.5% | conditional |
| brand_075 | mixed | 4.5% | conditional |
| brand_076 | positive | 4.3% | conditional |
| brand_077 | positive | 12.0% | moderate |
| brand_078 | mixed | 0.0% | strong |
| brand_079 | mixed | 0.0% | conditional |
| brand_080 | mixed | 16.0% | conditional |
| brand_081 | mixed | 42.9% | conditional |
| brand_082 | mixed | 4.2% | conditional |
| brand_083 | positive | 40.0% | moderate |
| brand_084 | mixed | 19.2% | conditional |
| brand_085 | mixed | 0.0% | conditional |
| brand_086 | mixed | 7.4% | conditional |
| brand_087 | mixed | 0.0% | conditional |
| brand_088 | mixed | 4.3% | conditional |
| brand_089 | mixed | 4.2% | conditional |
| brand_090 | positive | 38.9% | strong |
| brand_091 | mixed | 21.7% | conditional |
| brand_092 | mixed | 4.2% | conditional |
| brand_093 | mixed | 0.0% | conditional |
| brand_094 | positive | 4.5% | conditional |
| brand_095 | positive | 0.0% | conditional |
| brand_096 | mixed | 0.0% | conditional |
| brand_097 | mixed | 7.7% | conditional |
| brand_098 | mixed | 8.7% | conditional |
| brand_099 | positive | 0.0% | strong |
| brand_100 | positive | 31.8% | moderate |
| brand_101 | positive | 0.0% | conditional |
| brand_102 | mixed | 5.3% | conditional |
| brand_103 | positive | 8.0% | conditional |
| brand_104 | mixed | 0.0% | conditional |
| brand_105 | mixed | 0.0% | conditional |
| brand_106 | positive | 27.3% | moderate |
| brand_107 | mixed | 21.7% | conditional |
| brand_108 | positive | 19.0% | moderate |
| brand_109 | mixed | 4.5% | conditional |
| brand_110 | mixed | 4.8% | conditional |
| brand_111 | mixed | 0.0% | conditional |
| brand_112 | mixed | 4.3% | conditional |
| brand_113 | mixed | 8.7% | conditional |
| brand_114 | mixed | 0.0% | conditional |
| brand_115 | mixed | 41.7% | conditional |
| brand_116 | positive | 16.7% | conditional |
| brand_117 | mixed | 20.8% | conditional |
| brand_118 | positive | 12.5% | strong |
| brand_119 | mixed | 25.0% | conditional |
| brand_120 | mixed | 13.0% | conditional |
| brand_121 | mixed | 7.7% | conditional |
| brand_122 | mixed | 13.0% | conditional |
| brand_123 | mixed | 13.6% | conditional |
| brand_124 | mixed | 27.3% | conditional |
| brand_125 | mixed | 0.0% | conditional |
| brand_126 | mixed | 4.2% | conditional |
| brand_127 | mixed | 9.5% | conditional |
| brand_128 | positive | 5.3% | conditional |
| brand_129 | positive | 0.0% | moderate |
| brand_130 | positive | 4.8% | strong |
| brand_131 | positive | 4.8% | conditional |
Across the brands tested, how often a brand appeared had essentially no relationship to whether the model described it positively or with caveats — statistically, next to none at all.
The pattern held at both ends. The brands that appeared most often still skewed more mixed than positive in tone. And several brands with strong, positive framing had low organic visibility to begin with. More appearances and a better narrative simply didn't move together.
This doesn't mean visibility and framing can never affect each other — it means they're answering two different questions, and a single score can't capture both. A brand can become more visible and still be stuck with the same mixed or conditional description it had before.
KEY TAKEAWAY
Appearing more and being described better are separate outcomes, and improving one doesn't automatically improve the other. A brand that pushes hard on visibility without addressing how it's actually described risks the same mixed narrative — just repeated more often, to more people.
WHAT TO DO
- Audit how the brand is actually described: positioning, caveats, repeated tradeoffs, and recommendation strength — not just whether it's mentioned
- Check whether framing is consistent across different buyer personas and intents, not just in aggregate
- Treat a visibility push and a framing fix as two separate projects — one doesn't substitute for the other
Tone and recommendation pattern are aggregate classifications across conversations for each brand. The relationship described here is descriptive, based on the tested brands, and does not establish that visibility and framing can never influence each other under different conditions.
ROBUSTNESS CHECK
These patterns hold across business categories, not just a few
The core patterns were not driven by one SaaS category
| Pattern checked | Supporting functions |
|---|---|
| Recommendation-seeking > informational | 12 of 12 |
| Competitor-owned citations > brand-owned citations | 12 of 12 |
| Category-led > fully unbranded | 11 of 12 |
The brands tested weren't spread evenly — some business functions had far more brands in the test set than others. So before trusting any of the six findings, the natural question is whether they're really just describing the largest group, and would look different for a smaller, more balanced set of companies.
They don't. Rerunning the test on a balanced set — the same number of conversations and personas for every brand, regardless of function — produced numbers close to the full dataset across the board: organic appearance (11.9% vs. 12.2%), fully unbranded appearance (5.6% vs. 5.4%), category-led appearance (14.3% vs. 14.8%), recommendation-seeking appearance (20.9% vs. 21.5%), and informational appearance (5.1% vs. 5.1%). Nothing shifted by more than a point.
The direction of the findings held at the individual business-function level too. Recommendation-seeking questions beat informational ones in all 12 functions tested. Competitor-owned citations outnumbered brand-owned ones in all 12. Category-led questions beat fully unbranded ones in 11 of 12. The size of the effect moved around some, especially in the functions with only a handful of brands — but which direction it pointed in almost never did.
KEY TAKEAWAY
These findings hold up across different types of companies, not just the largest group in the study. That's confidence the patterns are real — not confidence that they'll look identical in every market, every AI model, or a year from now.
The balanced cohort ran exactly 40 conversations and 5 personas per brand, regardless of business function, to remove the effect of larger functions receiving more test volume.
METHODOLOGY
How the test set was built
The study covered 131 B2B SaaS brands across 12 business functions, from Sales & Revenue to People, Learning & Performance — the full breakdown is below.
STEP 1
Brand profiling
We built a detailed profile for each brand from 15-20 pages on its website. The profile captured category, positioning, audience, capabilities, competitors, use cases, and proof.
STEP 2
User profiles
Using the brand profile, we created three to five user profiles per brand. Each profile described the user's role rather than job title, the problems they face, and the language they would or would not use when speaking with ChatGPT.
STEP 3
Question generation
We generated 20-40 buyer-style conversational questions per brand. The set included organic, brand-led, and competitor-led contexts and intentionally avoided keyword-first questions.
STEP 4
Adaptive multi-turn conversations
Every conversation began with a buyer-style question. Most ended after the first answer. When the model's first answer warranted deeper exploration, we asked a follow-up based on what it actually said — not a scripted second question. Conversations were capped at three turns.
Question design examples
Instead of: What's the best software in [category]?
Used: Can you recommend software for [problem the user is facing]?
Instead of: [Brand] vs [competitor]
Used: Between [brand] and [competitor], what would you recommend for [problem the user is facing]?
Conversation context mix
Share of all 5,055 conversations
| Context | Share | Conversations |
|---|---|---|
| Organic | 59.2% | 2,995 |
| Prompted | 21.1% | 1,065 |
| Competitor-led | 19.7% | 995 |
Question mix by buyer intent
Share of all 5,055 conversations
| Intent | Share | Questions |
|---|---|---|
| Comparison | 30.1% | 1,522 |
| Brand-Aware | 21.1% | 1,065 |
| Diagnostic | 13.2% | 665 |
| Tactical / How-To | 12.8% | 649 |
| Transactional / Vendor Selection | 11.1% | 563 |
| Problem-Aware | 7.1% | 361 |
| Educational | 4.5% | 230 |
Question context and bias
Share of all 5,055 conversations
| Bias / context | Share | Questions |
|---|---|---|
| Category-led | 42.8% | 2,162 |
| Brand-led | 21.1% | 1,065 |
| Competitor-led | 19.7% | 995 |
| Unbranded | 16.5% | 833 |
Brands by business function
Number of brands
| Business function | Brands |
|---|---|
| Sales & Revenue | 42 |
| Marketing & Growth | 15 |
| Demo, Content & Visual Communication | 12 |
| AI Engineering, Evaluation & Security | 11 |
| Customer Success, Support & Retention | 10 |
| Developer Infrastructure & Integrations | 10 |
| Voice AI & Conversational Systems | 8 |
| Product Adoption & Digital Experience | 7 |
| Workplace Productivity & Knowledge | 6 |
| AI Agents & Workflow Automation | 4 |
| Product, Feedback & Research | 4 |
| People, Learning & Performance | 2 |
Download the complete research deck
Get the charts, methodology, and six findings in a presentation-ready format.
Download the PDFFind out what ChatGPT says about your brand.
Share your website. We’ll test real buyer questions specific to your brand in ChatGPT and deliver a reviewed analysis showing where your brand appears, how it is framed, which competitors and sources shape the answers, and what to do next.
Full Viziquo analyses include ChatGPT, Claude, Gemini, Google AI Mode, Google AI Overview, Microsoft Bing AI Answers (Copilot Search), and Perplexity.
Free · No credit card needed · Delivered within 3 business days